Introducing our new Partner Program for Atlassian Solution Partners!
Partner Program → Learn More
Powerful ITSM analytics solution for Service Management teams build and share intuitive cross-project reports in Jira or JSM Portal
Service data is often scattered across multiple projects, making it hard to get the full picture. As a result, cross-functional teams are stuck in reactive mode, addressing problems only after they’ve escalated.
Different teams relying on separate reporting tools lead to miscommunication when addressing shared service challenges, resulting in delays in identifying critical problems and potential SLA breaches.
Siloed data makes it difficult for leadership to clearly see service performance, costing valuable time to track metrics across projects, that could be spent on strategic improvements.
Graphy is a flexible ITSM analytics and custom reporting solution for Jira and Jira Service Management. It empowers service management teams of all sizes to build and share cross-project reports to visualize key service metrics, from request volumes and SLA performance to asset data, all in one place.
Build service management reports in seconds with ready-to-use ITSM dashboards and pre-built metrics – (SLAs, requests, assets, and more). It’s all your service data, finally in one place.
Search, filter, and explore cross-project data, consolidating insights from Jira, Jira Service Management, and Assets into a single, centralized view for all teams.
Easily share real-time reports with customers, external stakeholders, or executives, securely through the JSM customer portal or internally with Jira users and groups using custom permissions.
Dashboard templates and pre-built metrics for ITSM (SLA, Requests, Incidents, Change management and more).
The intuitive drag-and-drop interface lets you add and arrange gadgets (charts, cards, metrics) to create and customize your dashboard in seconds.
Build custom charts (1D, 2D) using system and custom fields, or leverage dedicated Assets gadgets to visualize and track asset-related data.
Filter data using simple point-and-click options (Basic filters) or advanced JQL queries. Apply interactive drill-downs directly within charts.
Effortlessly configure your dashboard’s data with cross-project dashboard filters, bringing insights from all your Jira and Jira Service Management projects into one central view.
Share live dashboards with team members, leadership, or even customers in the JSM portal with just a few clicks or export in PDF, CSV, or PNG
Built with Atlassian Forge, the app runs entirely on Atlassian’s secure cloud infrastructure, ensuring enterprise-grade security out of the box.
The app is fully hosted and operated within Atlassian’s infrastructure, with no data outflow and no access by us or any third parties.
Atlassian Forge ensures your Jira data residency settings are automatically applied to all app data, ensuring compliance with organizational requirements.
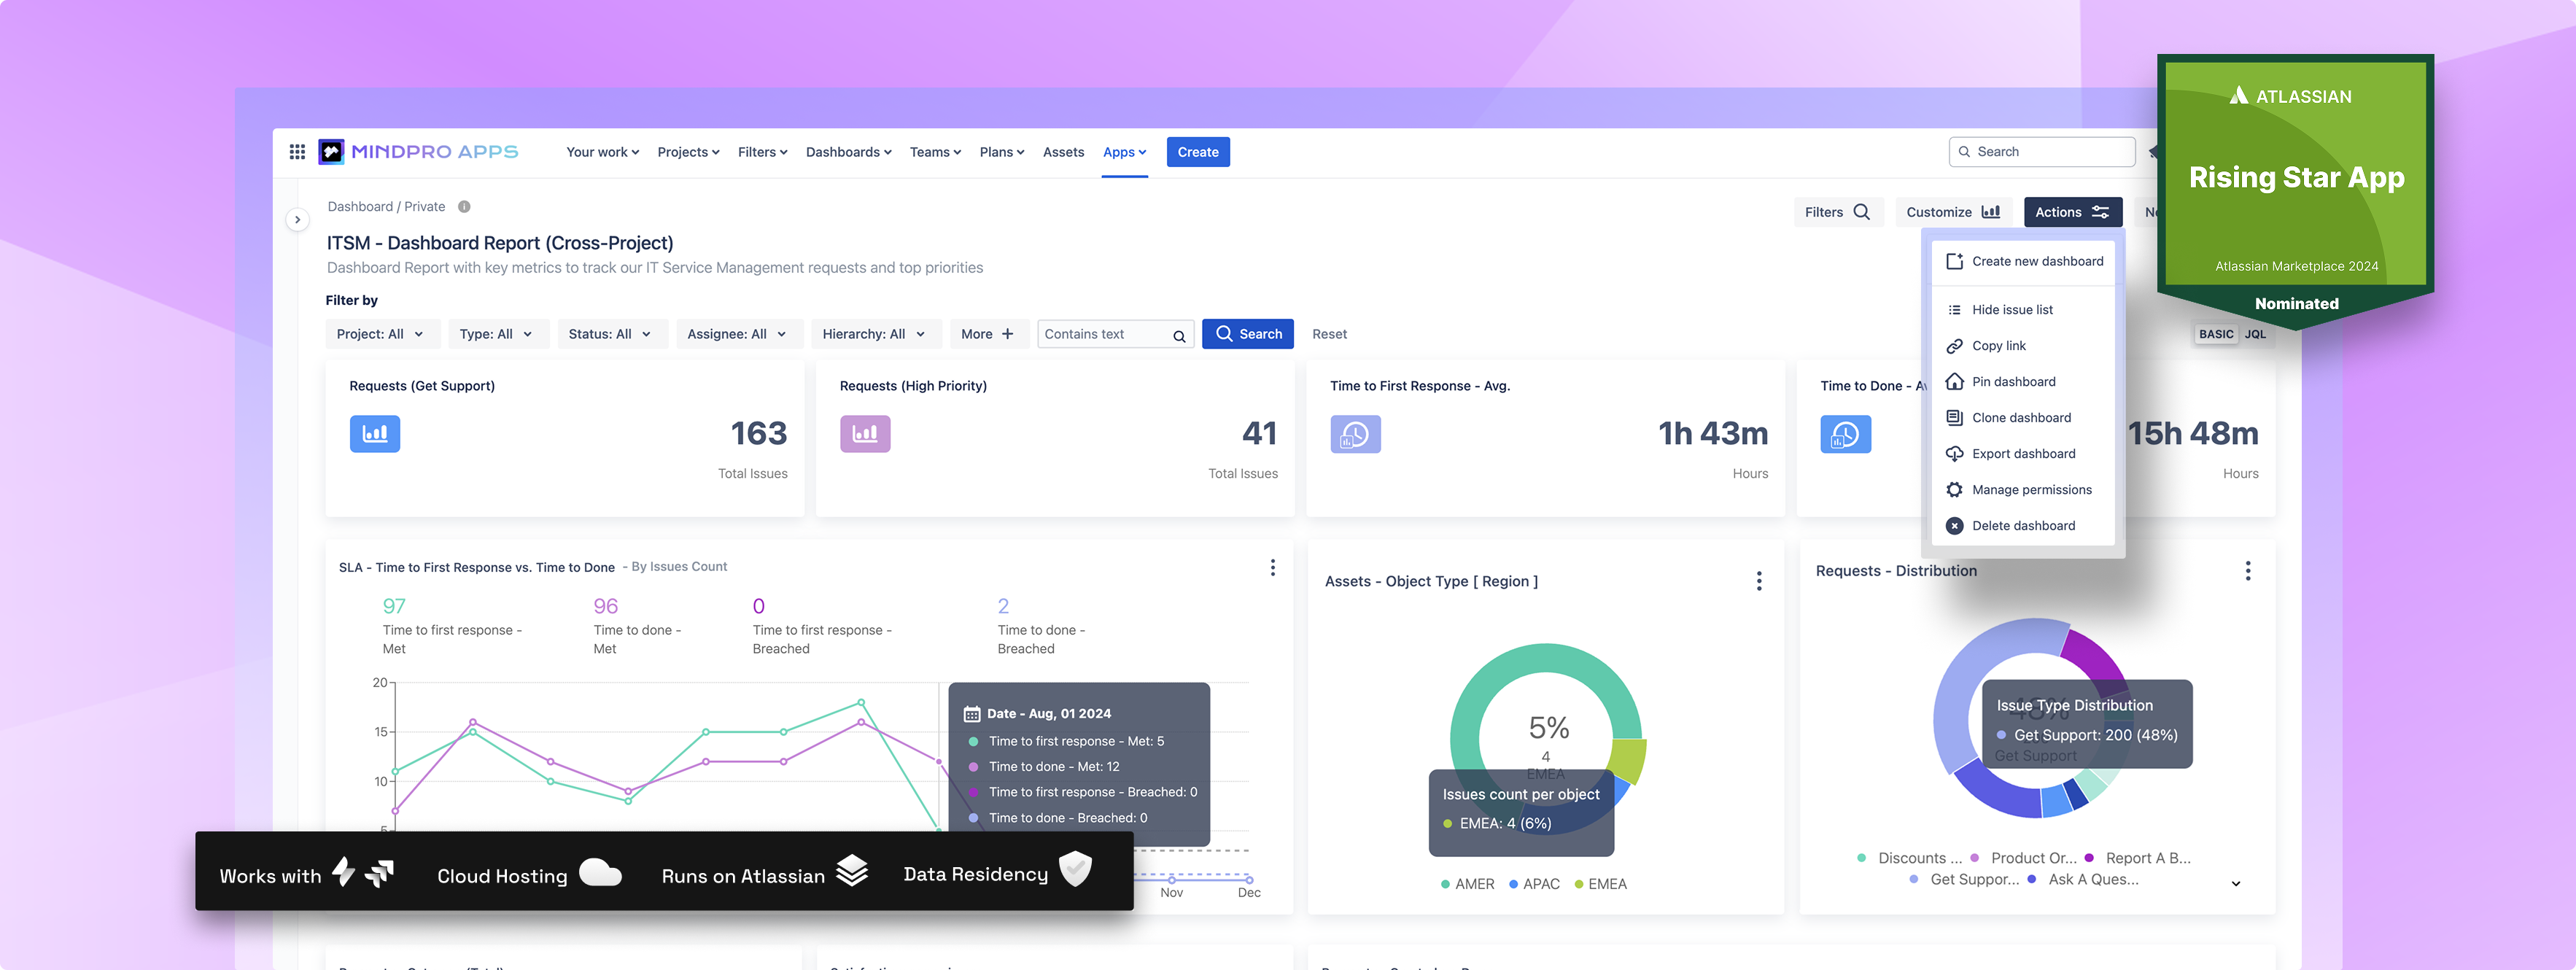
Responsible for overall support performance and SLA compliance across projects, IT Service Managers can use cross-project dashboards to spot teams at risk of SLA breaches and reallocate resources proactively.
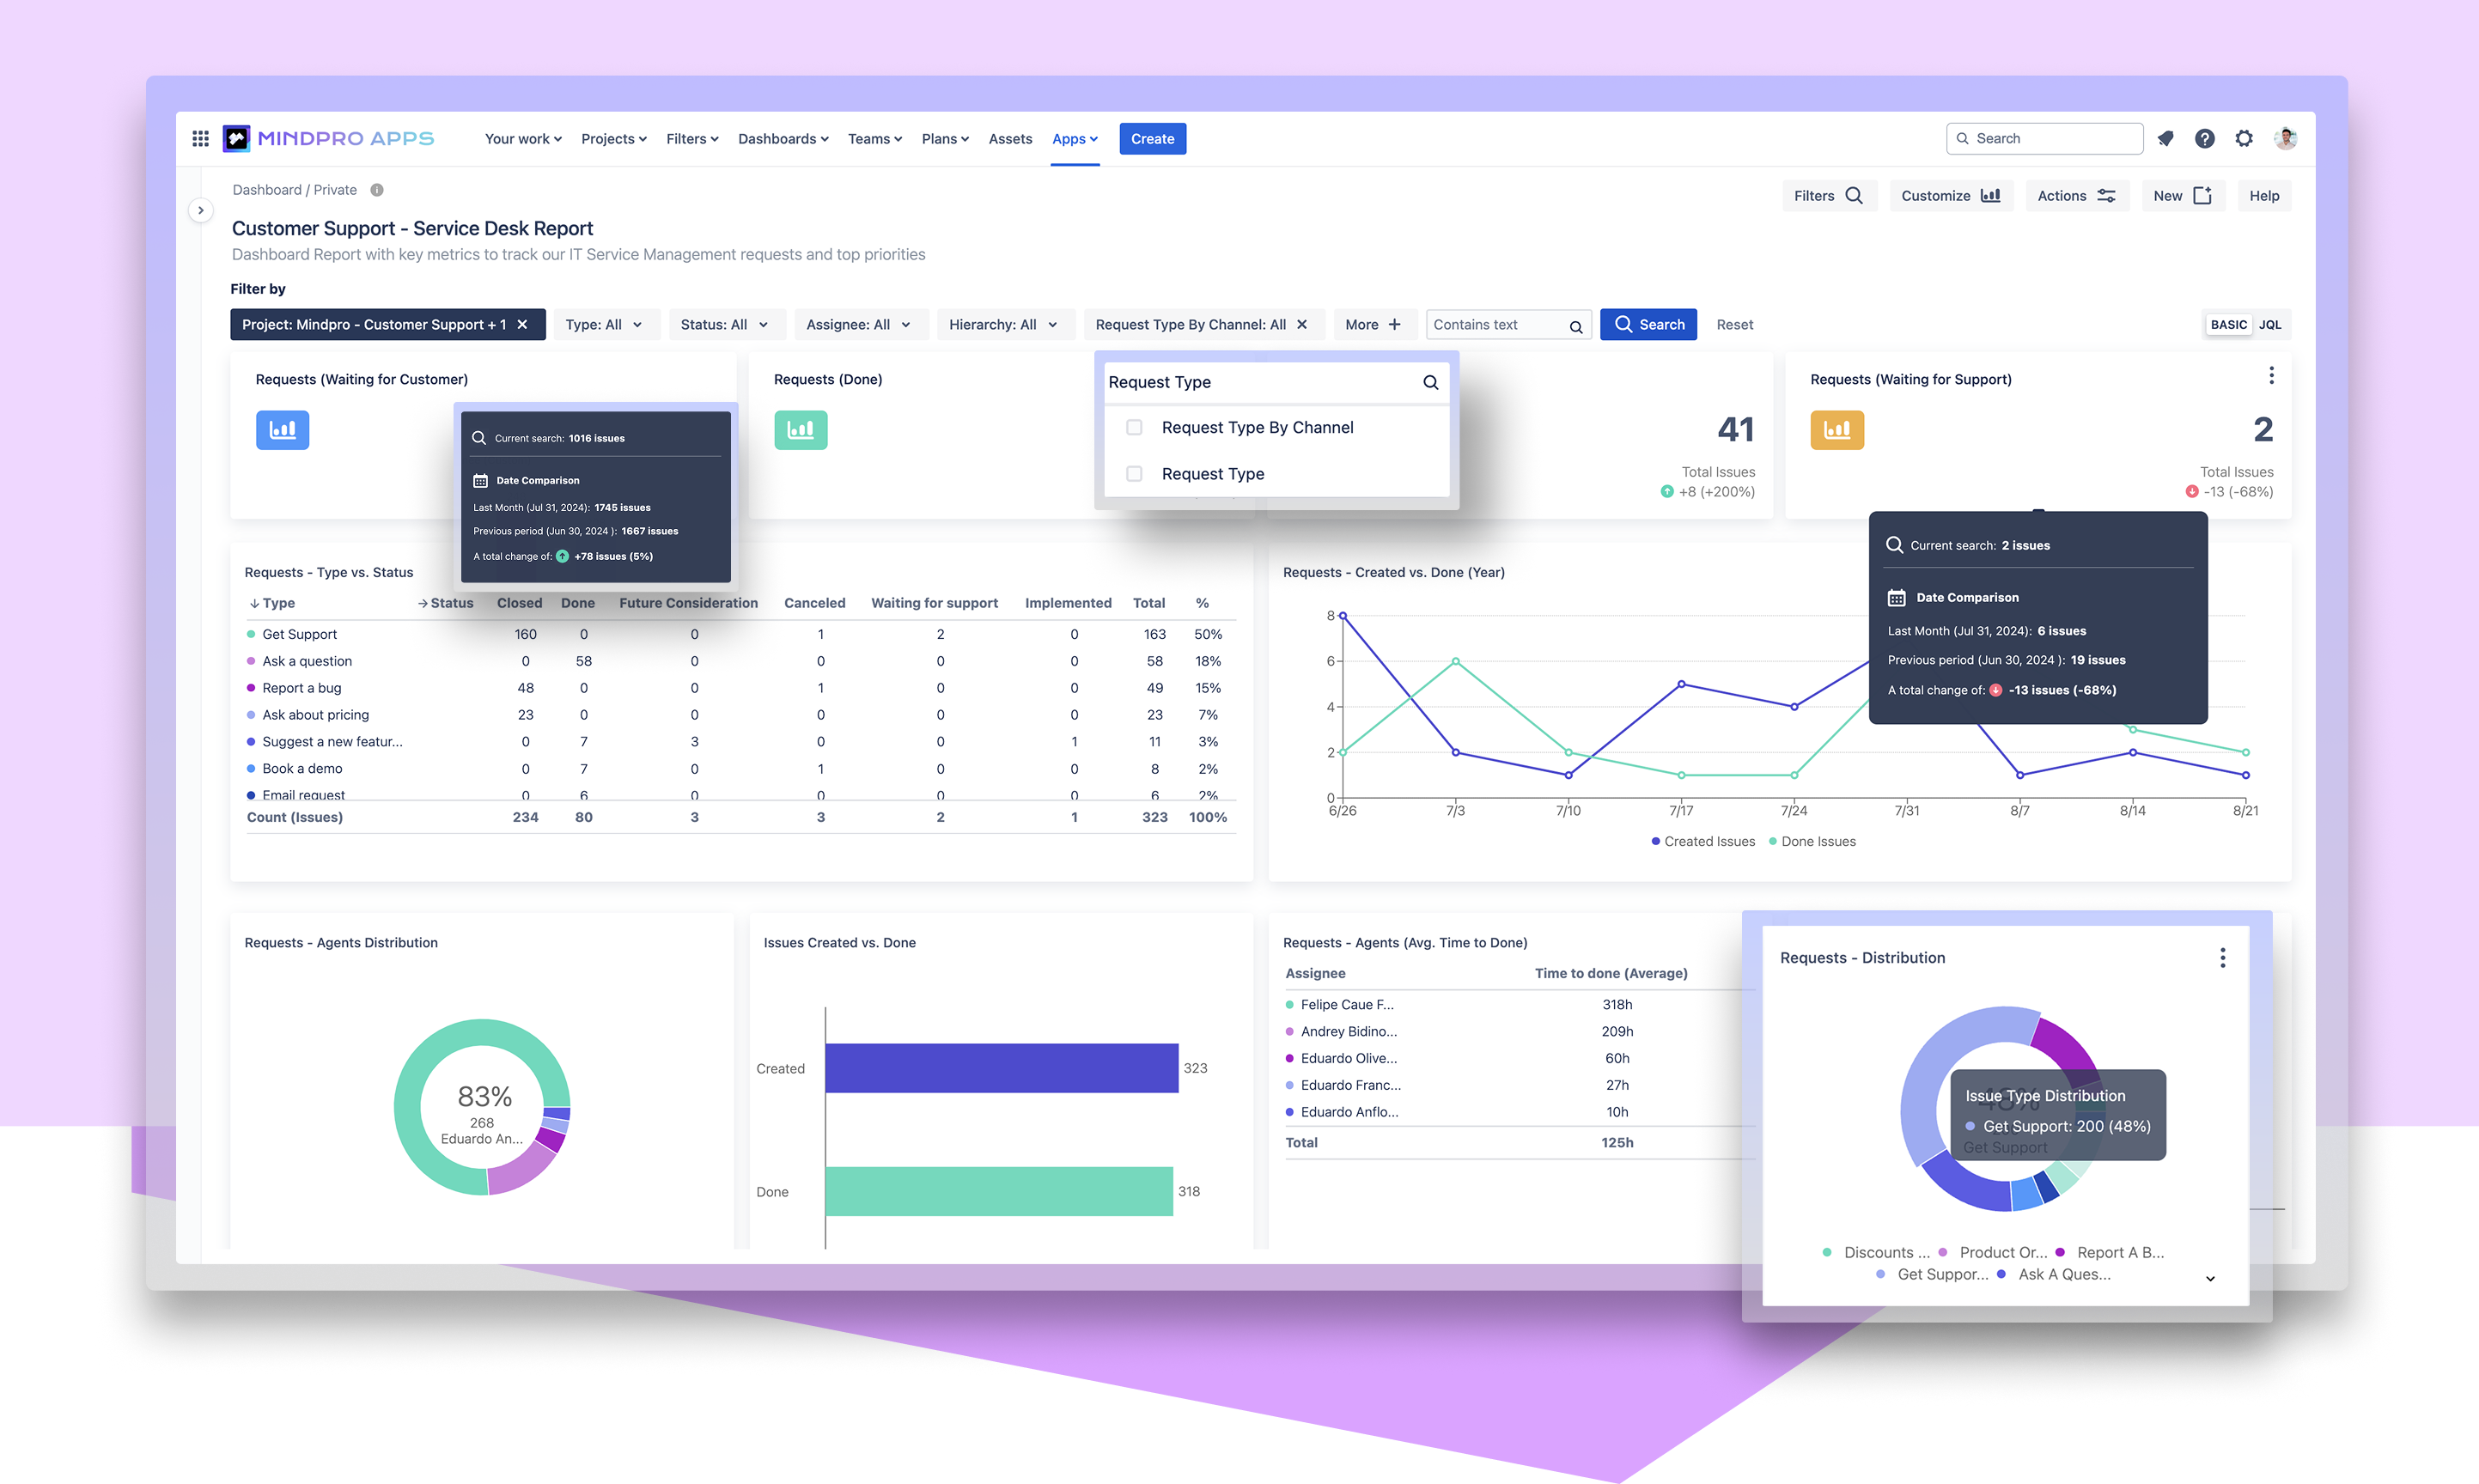
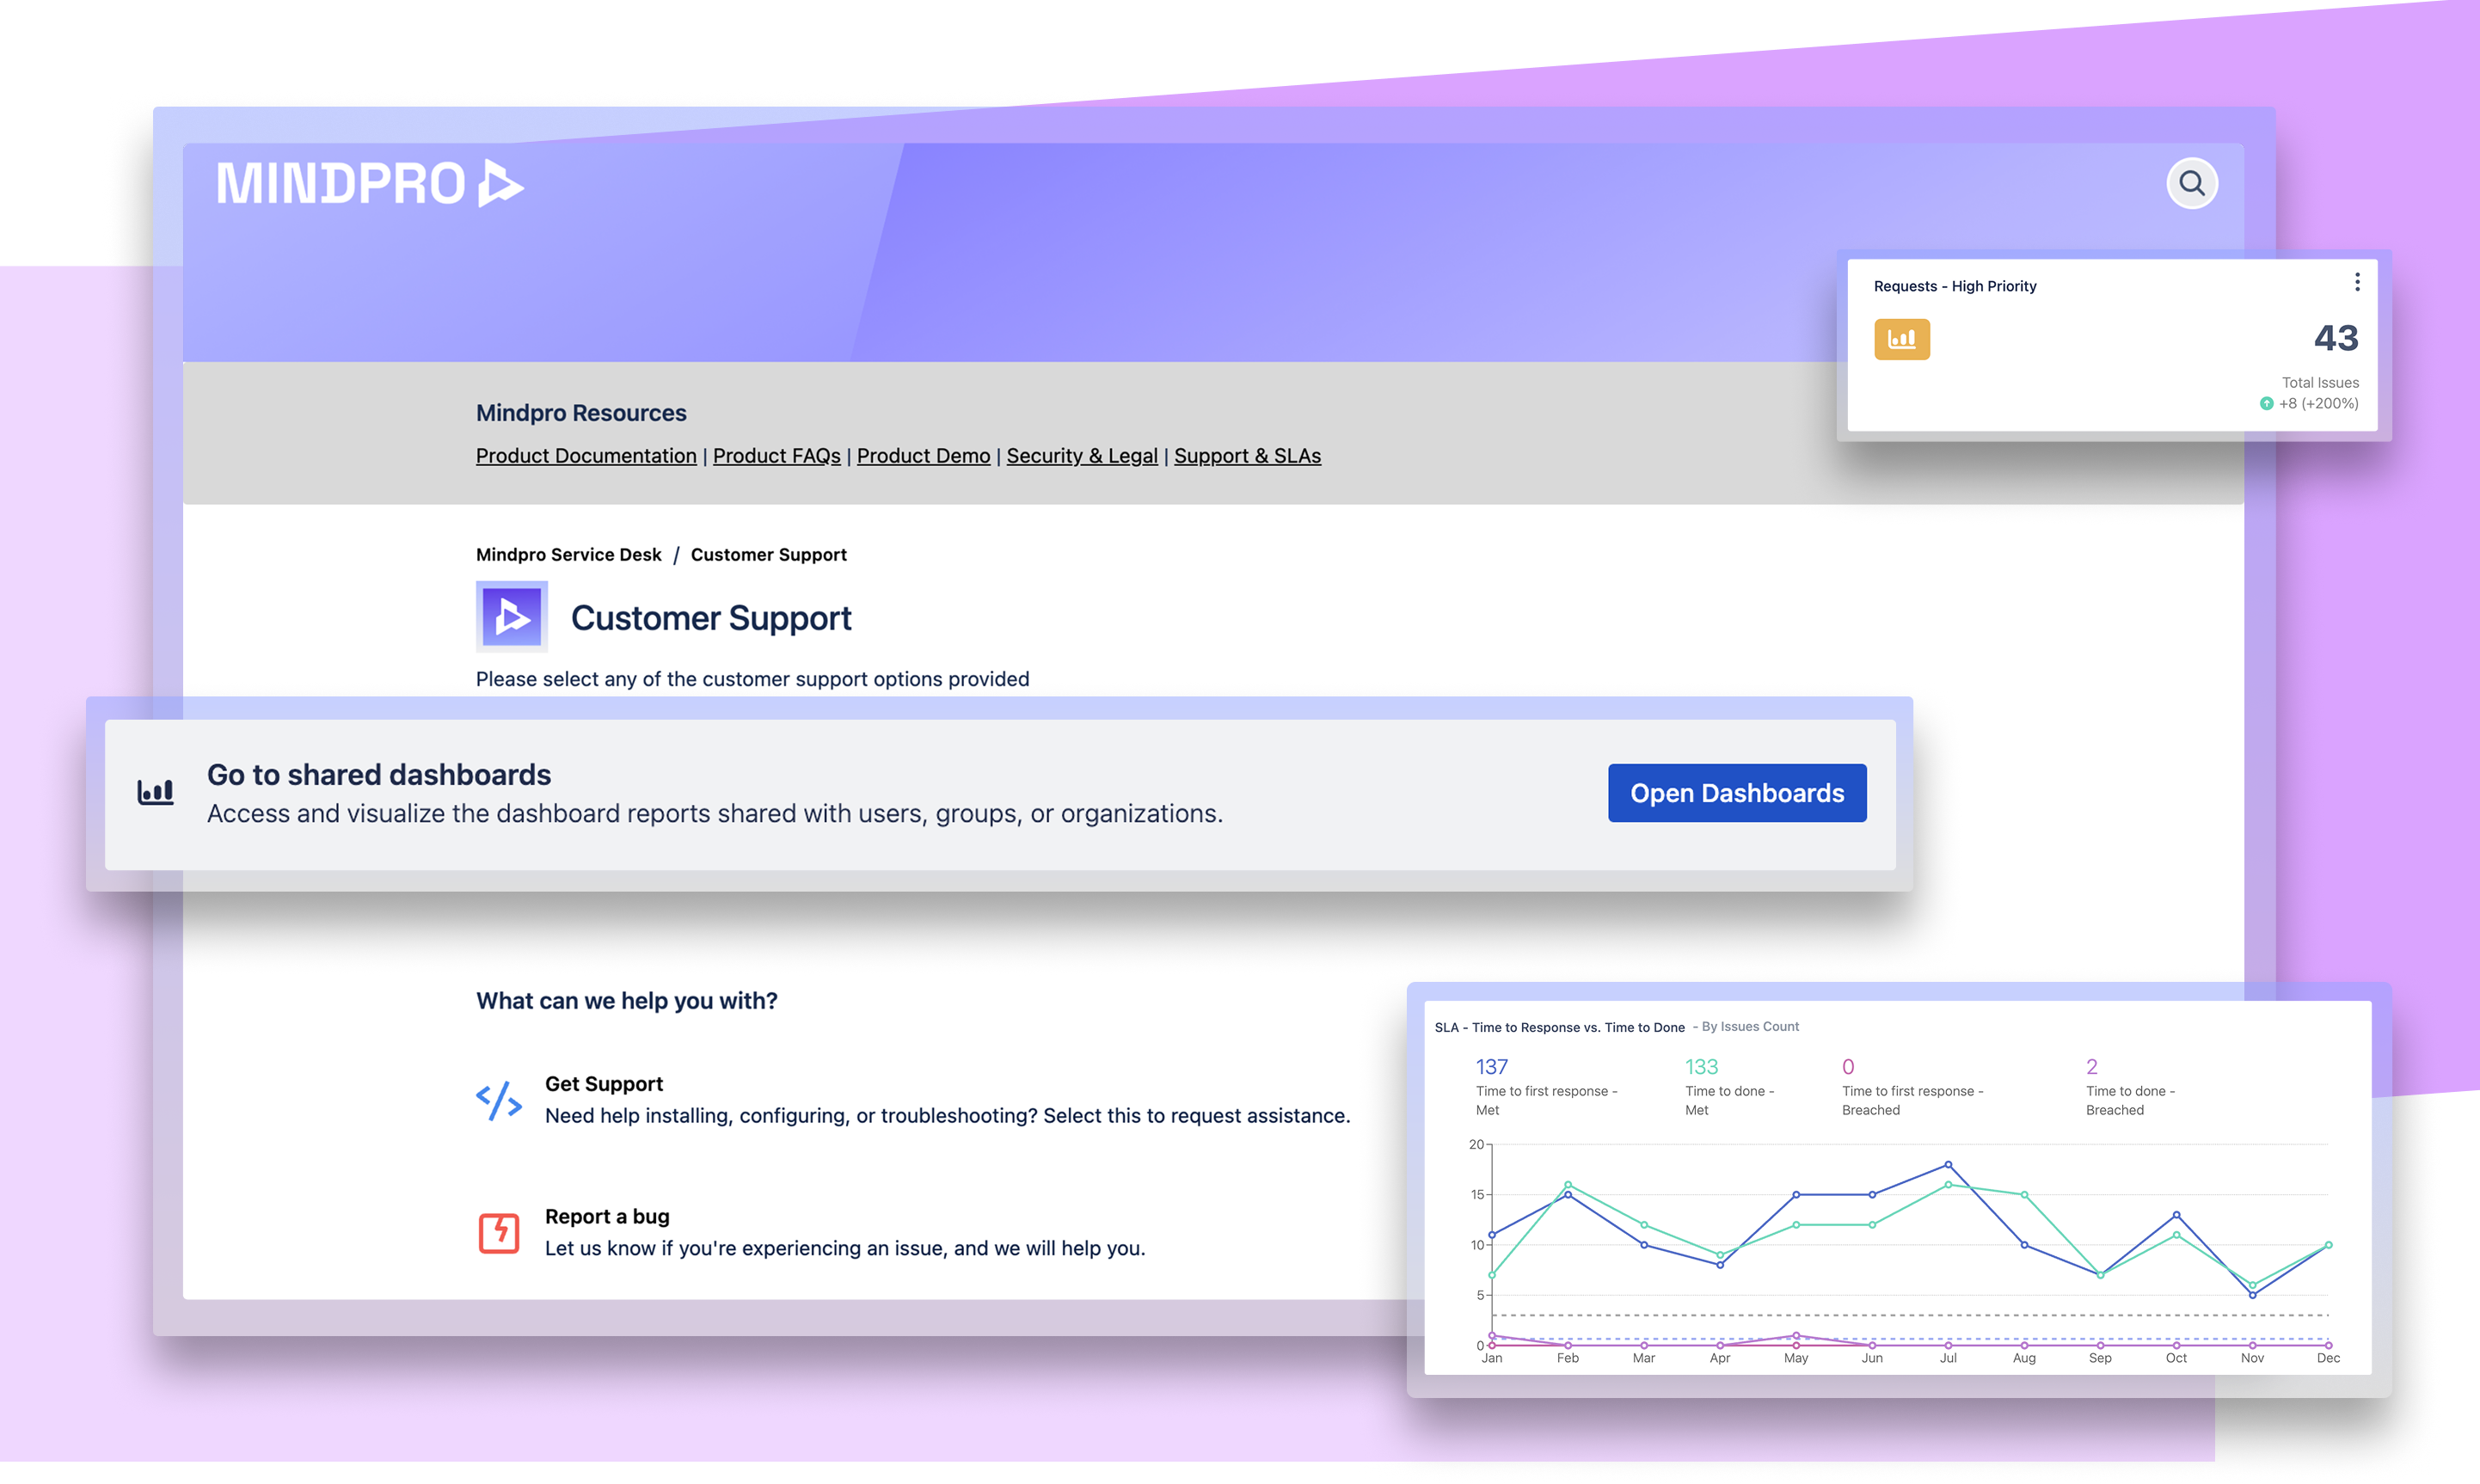
Support leads managing daily customer requests can create and share real-time dashboards to track ticket trends, satisfaction scores, response times, and agent workloads, all in one view.
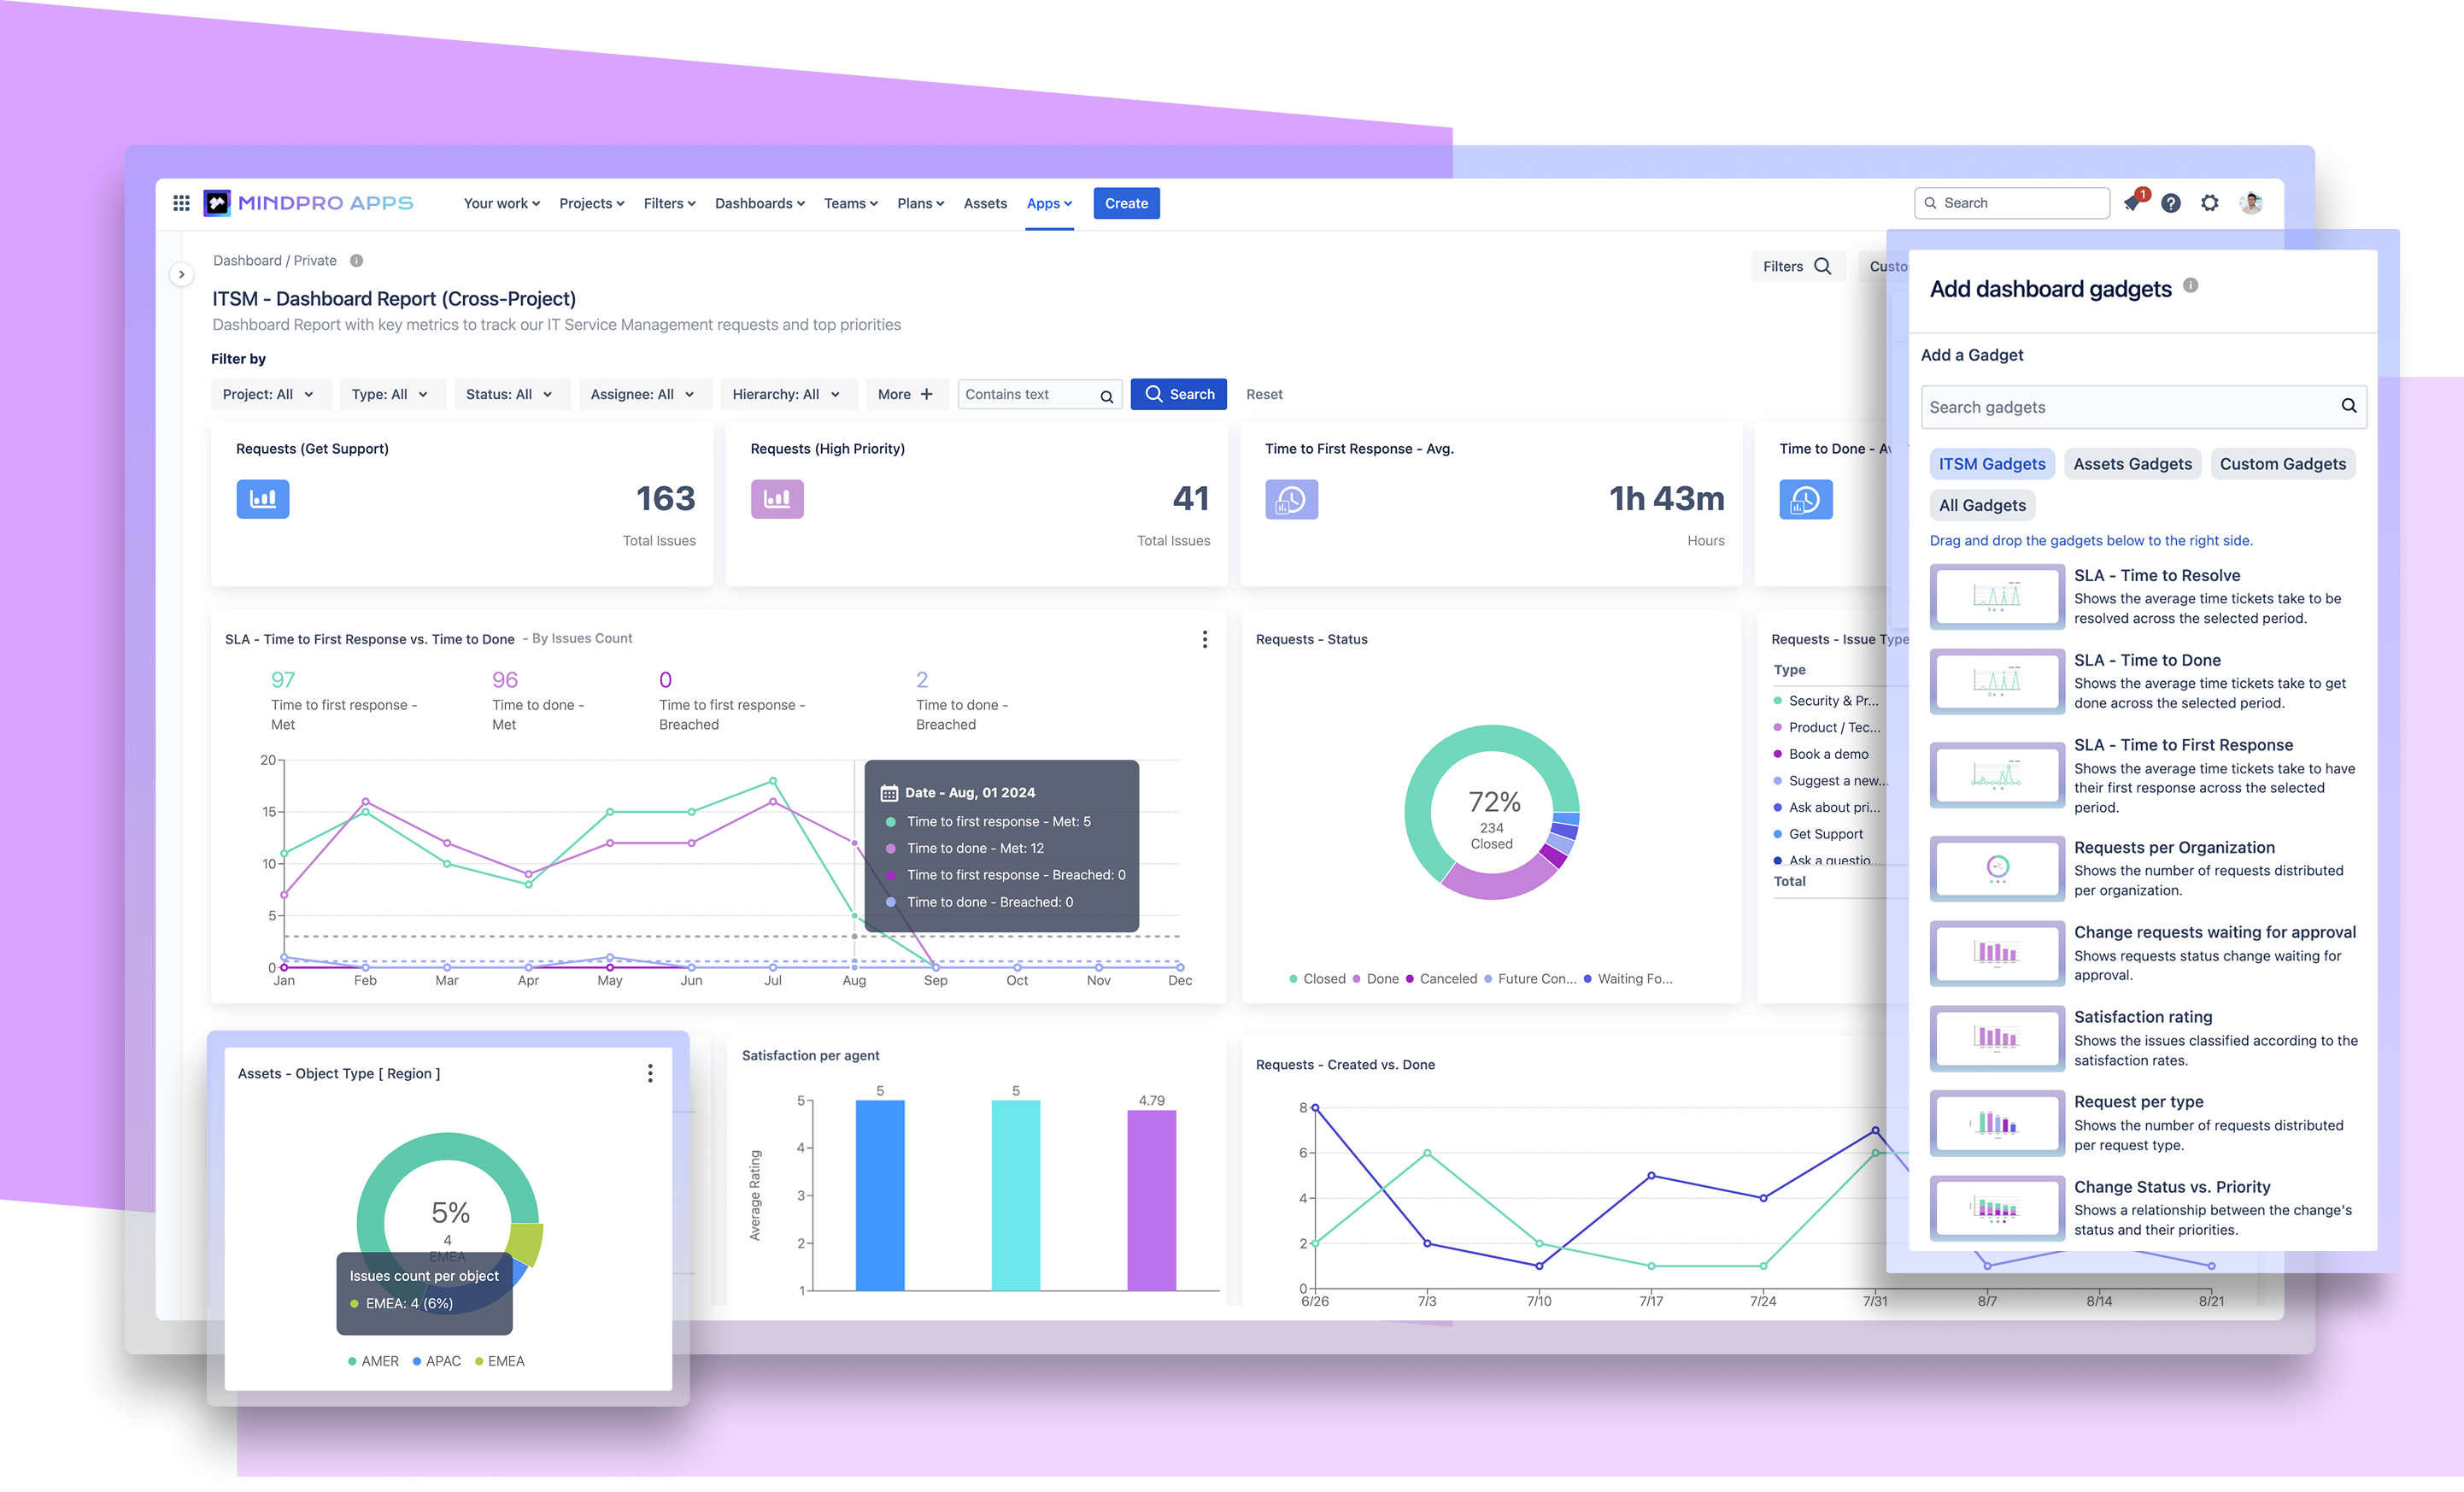
Ops teams managing incidents, changes, and infrastructure can use a unified view to track issues and assets across all systems, clearly seeing how configuration items from the CMDB relate to recurring incidents.
IBM is a global tech powerhouse operating in over 175 countries, with more than 280,000 employees driving innovation, cloud, and enterprise services.
Trusted by 90% of Fortune 100 companies, IBM helps organizations modernize infrastructure, and accelerate digital transformation across industries. Managing distributed IT service operations at scale requires clear, reliable SLA oversight and streamlined performance reporting across teams and regions.
IBM uses Graphy to centralize ITSM reporting across its Jira Service Management projects, giving global teams real-time visibility into SLAs, request trends, and performance goals.
With intuitive cross-project dashboards, teams can swiftly spot bottlenecks, track progress, and fine-tune service delivery across departments. This enhanced visibility drives data-informed decisions, and strengthens alignment across IBM’s global IT operations.
Get personalized assistance from our support team. Whether you're troubleshooting an issue or just have a quick question, we're here to help you every step of the way.
Learn More →
Explore our Help Center for detailed product guides, FAQs, and product feature details. It's your go-to resource for self-service learning and best practices.
Learn More →
Our dedicated Partner Support team is here to help you succeed. Access resources, raise requests, and collaborate directly with us to get the most out of our partnership.
Learn More →
Sync and display user attributes from Entra ID (Azure AD), Okta, and other IDPs across Jira and JSM. Built for teams who need to streamline their requests, approvals, and workflows.
Learn More →
Visualize, track, and manage issues across Jira and JSM projects in one place. Ideal for IT, DevOps, and Support teams managing requests and service queues at scale.
Learn More →
Powerful custom reporting for Agile, ITSM, and project teams. Build interactive dashboards with advanced filters, custom charts, and real-time metrics.
Learn More →
Discover why leading companies, from Fortune Global 500s to next-gen startups, are making the switch to Mindpro apps and solutions for Jira.